Federal Reserve’s Dot Plot Could Tell You About the Future of Interest Rates, Job Market
This week, all eyes are on the dot plot.
It may look like Space Invaders—the alien-blasting arcade game from the 1970s—but the “dot plot” and other charts released by the Federal Reserve this week say something about how much you’ll pay for a mortgage, and even how likely it is you’ll be laid off from your job.
KEY TAKEAWAYS
- The Federal Reserve’s economic projections released Wednesday caused some forecasters to change their economic outlook.
- Many economists think the Fed’s “dot plot” projection showing its intention to raise its key interest rate again in 2023 is not going to come true.
- Some, however, believe Fed policymakers aren’t bluffing when they say rates will stay higher for longer than they previously forecast.
- That means high rates on loans, certificates of deposits, and savings accounts, could be with us for a while.
When the Fed’s policy-setting committee met to decide whether to raise its benchmark interest rate from its current 22-year high Wednesday, there was no mystery about what they would do. Fed officials had heavily hinted they would keep the rate steady, and they did.1
Instead, watchers mostly cared about the Fed’s quarterly outlook for how the economy will do, and how high Fed officials think the fed funds rate will be at the end of each year for the next few years.2
Here’s what the dot plot and other charts mean, and how experts are reading the clues they provide about the economy:
Plotting the Course of the Economy
The all-important fed funds rate dictates how much interest banks pay to borrow money, and influences rates for all kinds of borrowing including mortgages, car loans, credit cards, business loans.
The rate is the Fed’s main tool of monetary policy: A lower rate means cheap loans, easy money, and economic stimulus. The Fed raises the rate when it wants to make borrowing painful, slow the economy, and put a lid on inflation. That’s what it’s doing now—the key interest rate is now at a 22-year high.3
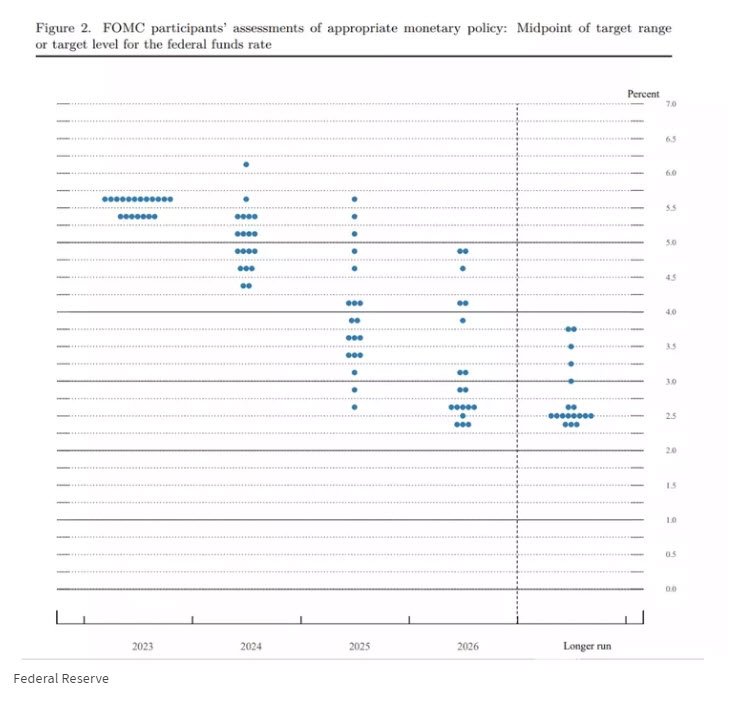
The dot plot tells the public what the Fed anticipates doing with the fed funds rate in the years to come.
Four times a year, the 19 members of the Federal Open Market Committee predict what they think the fed funds rate will be at the end of the next few years. Each person’s answer is represented by a dot on the chart, forming the “dot plot” seen below:4
FAST FACT: The “dot plot” is a relatively new addition to the central bank’s economic projection reports, having been introduced in 2012.
The dot plot is just an estimate, not a promise, and Fed officials often change their best-laid plans when their predictions about the economy don’t pan out. Here’s how economists interpreted the latest dot plot chart:
The Fed Funds Rate For The Rest of 2023
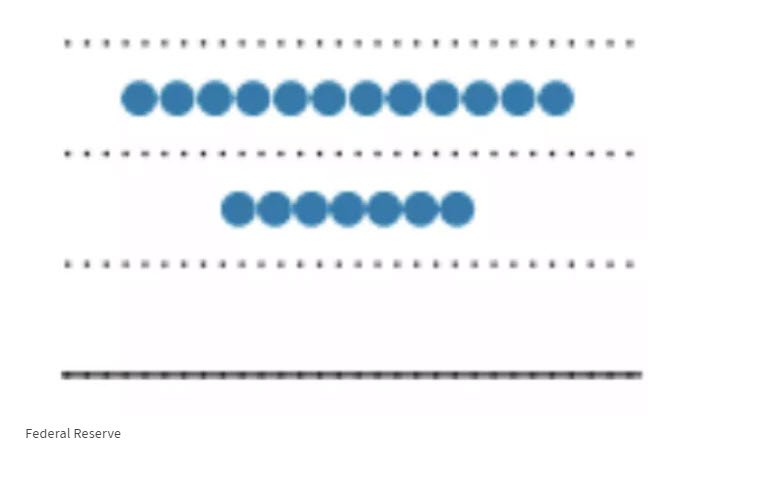
What it says: Seven members think the fed funds rate will stay at its current range of 5.25% to 5.5% through the end of the year, while 12 think it will have to go up another quarter-point.
What it means: Nothing, according to many economists who don’t think the Fed will follow through on its projected rate hike because inflation will fall faster than the Fed predicts.
“We think it is unlikely that the Fed will hike again,” John Ryiding and Conrad DeQuadros, economists at Brean Capital Markets, wrote in a commentary, a sentiment echoed by forecasters at several big banks.
The Fed Funds Rate For 2024 And Beyond
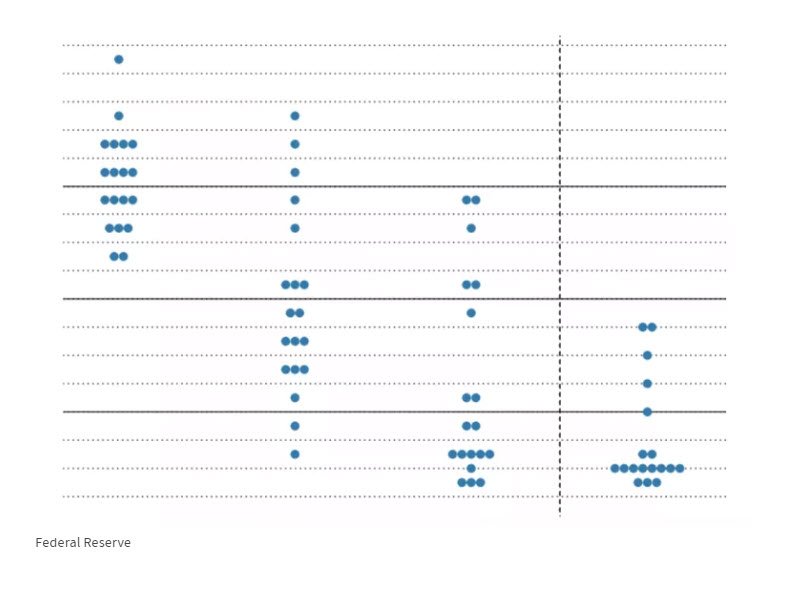
What it shows: Policymakers expect to keep the Fed’s benchmark interest rate above 5% through 2024. That’s a significant increase from the last projection in June, when they anticipated cutting the rate to a range of 4.50% to 4.75% on average.
What it means: The Fed is signaling interest rates will stay higher for longer. That means today’s painfully high rates on consumer loans, including mortgages and credit cards, could be with us for quite some time. And savers could continue to benefit from juicy returns on risk-free certificates of deposit and high-yield savings accounts.
Economists at Goldman Sachs took this forecast more seriously than they did the prospect of another rate hike this year, and pushed back their prediction for when the Fed will start to cut interest rates. Goldman now forecasts cuts will begin in the fourth quarter of 2024, back from the second quarter of 2023, Jan Hatzius, Goldman’s chief economist, together with other economists, wrote in a research note Thursday.
Beyond the dot plots, at least one other chart in the Fed’s report sent an important signal about the economy.
The Unemployment Rate
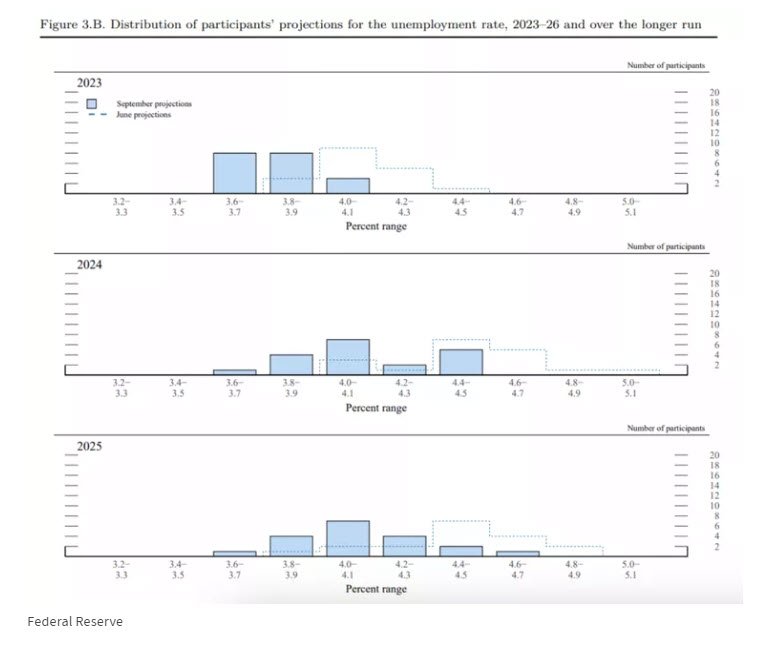
What it shows: Fed officials revised their predictions for unemployment downward. They now project the unemployment rate to be 4.1% at the end of 2024, only slightly above the 3.8% rate in August, not far from historic lows. It’s a significant downshift from June, when they thought 2024 would see 4.5% unemployment.
What it means: Fed officials increasingly believe they can slow the economy and cool inflation without causing mass unemployment—the extremely hard-to-achieve “soft landing” they’ve been aiming for.
This is a major shift in the Fed’s thinking, Goldman economists said.
“FOMC participants signaled that they think a meaningful rise in the unemployment rate is not necessary to tame inflation,” they wrote.
ARTICLE SOURCES
Investopedia requires writers to use primary sources to support their work. These include white papers, government data, original reporting, and interviews with industry experts. We also reference original research from other reputable publishers where appropriate. You can learn more about the standards we follow in producing accurate, unbiased content in our editorial policy.
- Federal Reserve. “FOMC Statement.”
- Federal Reserve. “Meeting calendars, statements, and minutes (2018-2024).”
- Federal Reserve. “Open Market Operations.”
- Federal Reserve. “Summary of Economic Projections.”
